The Whats and Hows of Jellyfish Dashboard
What is Jellyfish Dashboard?
Jellyfish Dashboard is a web application that allows you to manage your Jellyfish Media Server instance. It is a React application that uses the Jellyfish React Client API for adding and receiving tracks and Jellyfish Server API for adding peers, creating rooms etc.
It was created to help Jellyfish developers in testing but was later extended and adapted as a tool for tutorials and demos. Here, we present a short introduction to the dashboard and its features.
How to start Jellyfish Dashboard?
There are a couple of ways to start the dashboard:
- Up-to-date version
- Docker container
- Official repository
The current version of the dashboard is ready to use and available here. Ensure that it is compatible with your Jellyfish server! Please note that this dashboard only supports secure connections (https/wss) or connections to localhost. Any insecure requests (http/ws) will be automatically blocked by the browser.
The dashboard is also published as a docker image, you can pull it using:
docker pull ghcr.io/jellyfish-dev/jellyfish-dashboard:v0.1.2
You can also clone our repo and run dashboard locally
How to start Jellyfish Media Server?
For testing, we'll run the Jellyfish Media Server locally using Docker image:
docker run -p 50000-50050:50000-50050/udp \
           -p 5002:5002/tcp \
           -e JF_CHECK_ORIGIN=false \
           -e JF_HOST=<your ip address>:5002 \
           -e JF_PORT="5002" \
           -e JF_WEBRTC_USED=true \
           -e JF_WEBRTC_TURN_PORT_RANGE=50000-50050 \
           -e JF_WEBRTC_TURN_IP=<your ip address> \
           -e JF_WEBRTC_TURN_LISTEN_IP=0.0.0.0 \
           -e JF_SERVER_API_TOKEN=development \
           ghcr.io/jellyfish-dev/jellyfish:0.5.0-rc0
Make sure to set JF_WEBRTC_TURN_IP and JF_HOST to your local IP address. Without it, the mobile device won't be able to connect to the Jellyfish.
To check your local IP you can use this handy command (Linux/macOS):
ifconfig | grep "inet " | grep -Fv 127.0.0.1 | awk '{print $2}'
How to use Jellyfish Dashboard?
Since we have Dashboard and Jellyfish Media Server up and running, we can dive into the features.
Connecting to the server
We started the dashboard and the Jellyfish Media Server separately, so we need to connect them.
- Open the dashboard in your browser. Open the side menu and fill in the parameters:
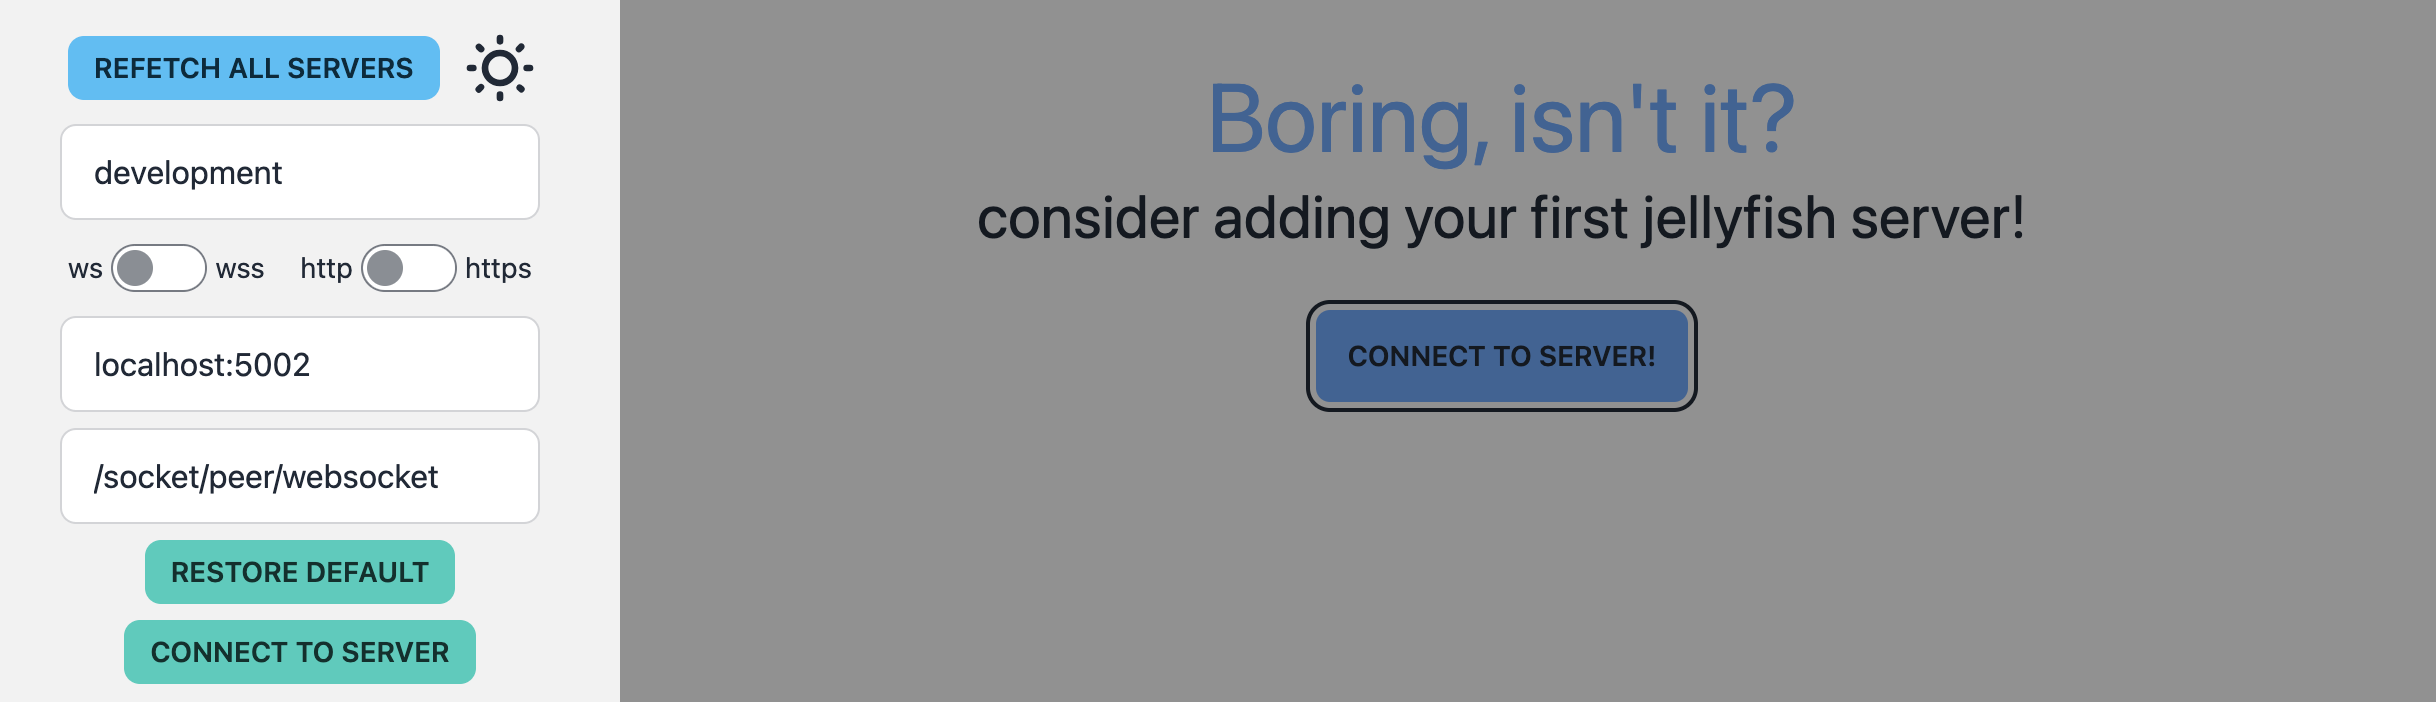
- Server token - a token necessary to authenticate the dashboard with the Jellyfish. For now, it's simply
development, but it is meant to authenticate the dashboard to the Jellyfish, so the good practice is to use a token that is hard to guess. - WS/WSS - whether to use a secure or insecure connection. , it's
ws, but if the Jellyfish uses secure WebSocket, usewss. - HTTP/HTTPS - whether to use a secure or insecure connection. By default, it's
http, but if the Jellyfish uses secure HTTP, usehttps. - Server URL - URL of the Jellyfish server. Here,
localhost:5002would be a local build, but it can be any URL that points to the Jellyfish. - Socket Path - path to the WebSocket endpoint. The default value is
/socket/peer/websocket.
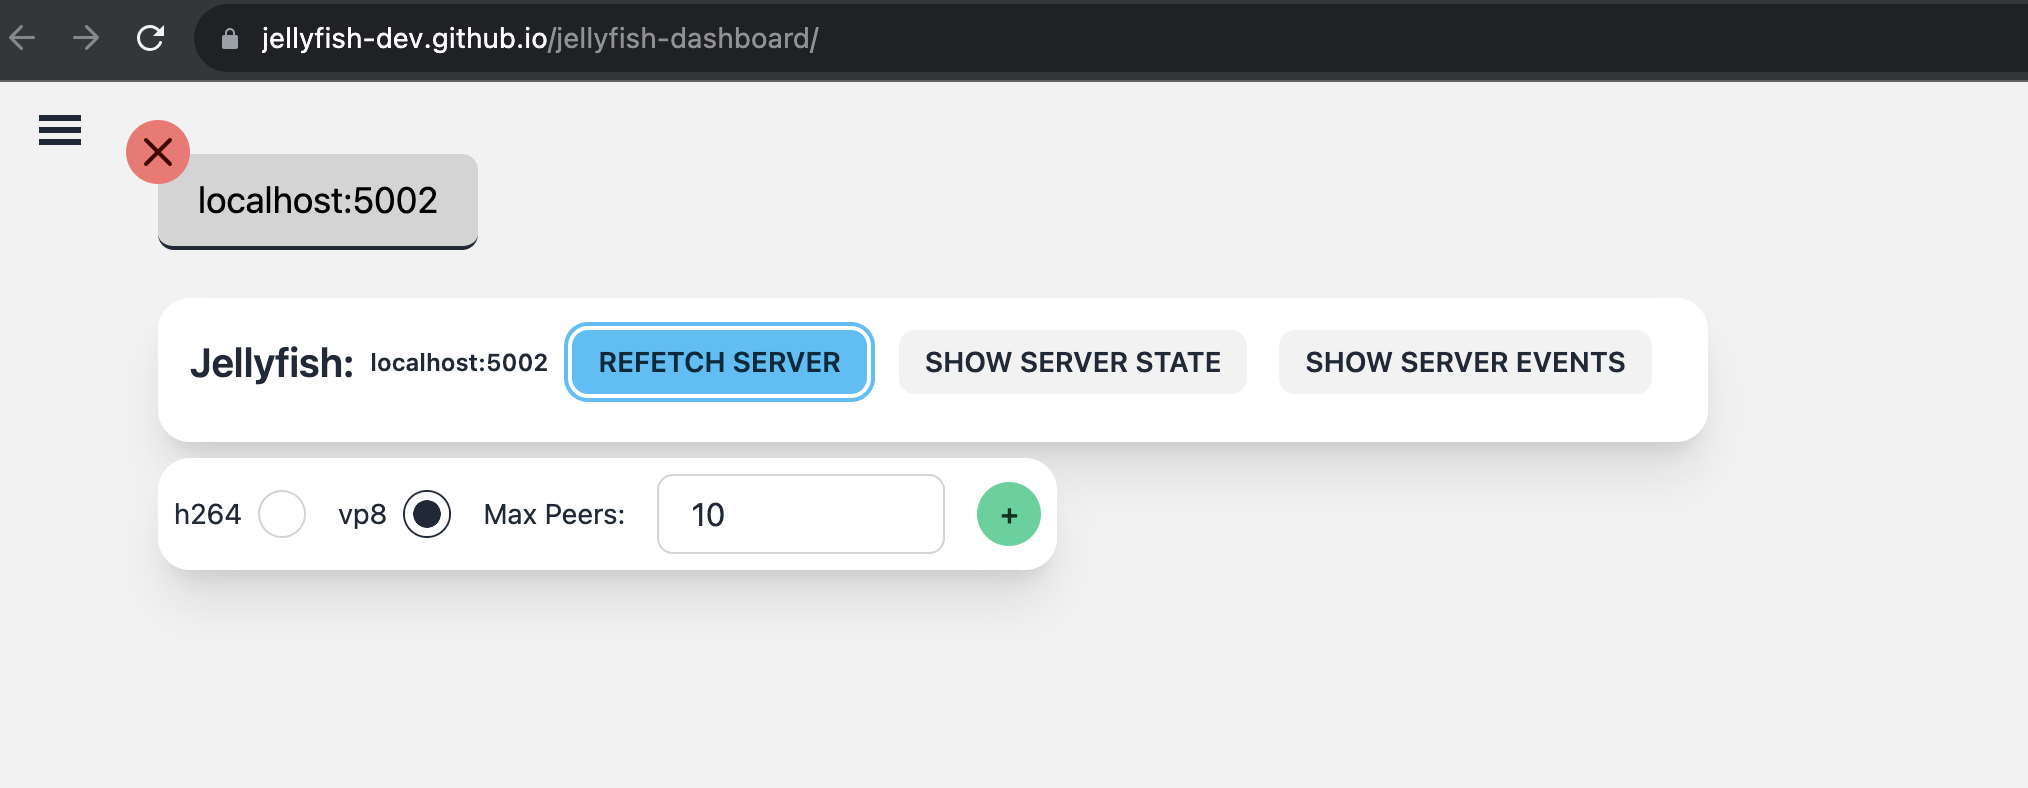
- Click Connect to server. If everything is correct, a server will appear in the list of connected servers:
Creating a room
There are plenty of settings that You can adjust in a room:
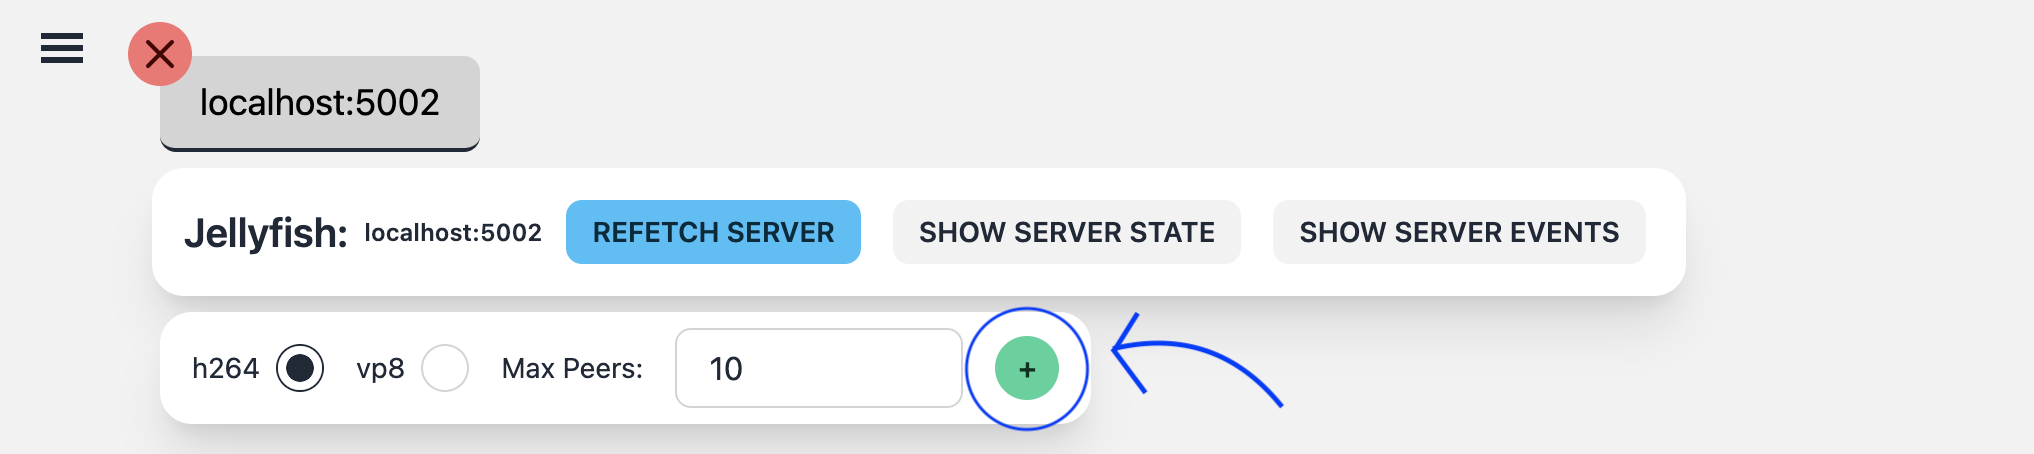
- h264 or vp8 - video codec used in the room. If you want to use
HLSstreaming, you need to useh264. - Max Peers - maximum number of peers that can join to the room.
When you select the settings, click the Add room button. If everything is correct, a room will appear in the list of rooms:
Adding and connecting peers to the room
Using the Create peer button, you can create a peer that will be ready to connect to the room.
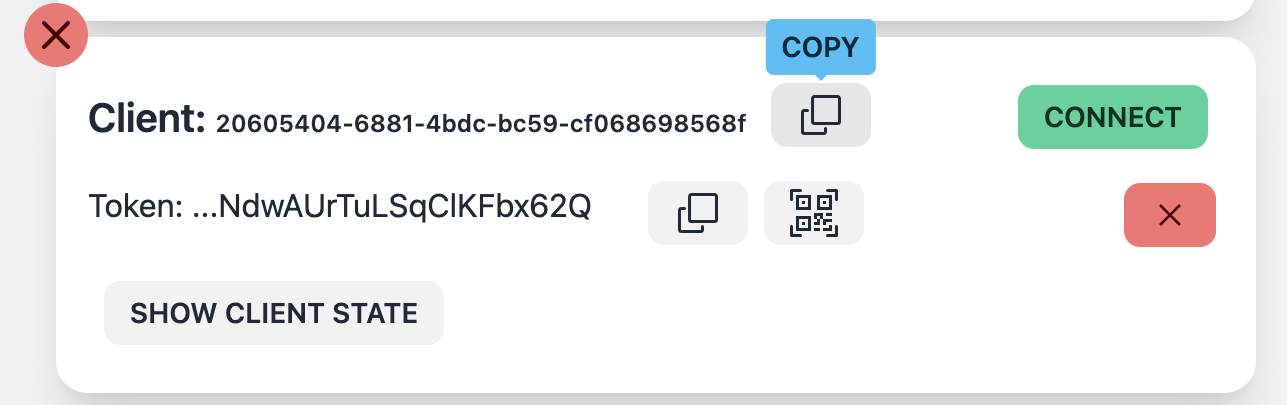
The peer has its ID and Token.
The ID is used to identify the peer in the Jellyfish Server, and the Token is used to authenticate the peer with the Jellyfish Server.
Dashboard has an option to copy both of those values to the clipboard.
You can also create a QR code with the peer's Token to make connecting to Jellyfish with a mobile device easier.
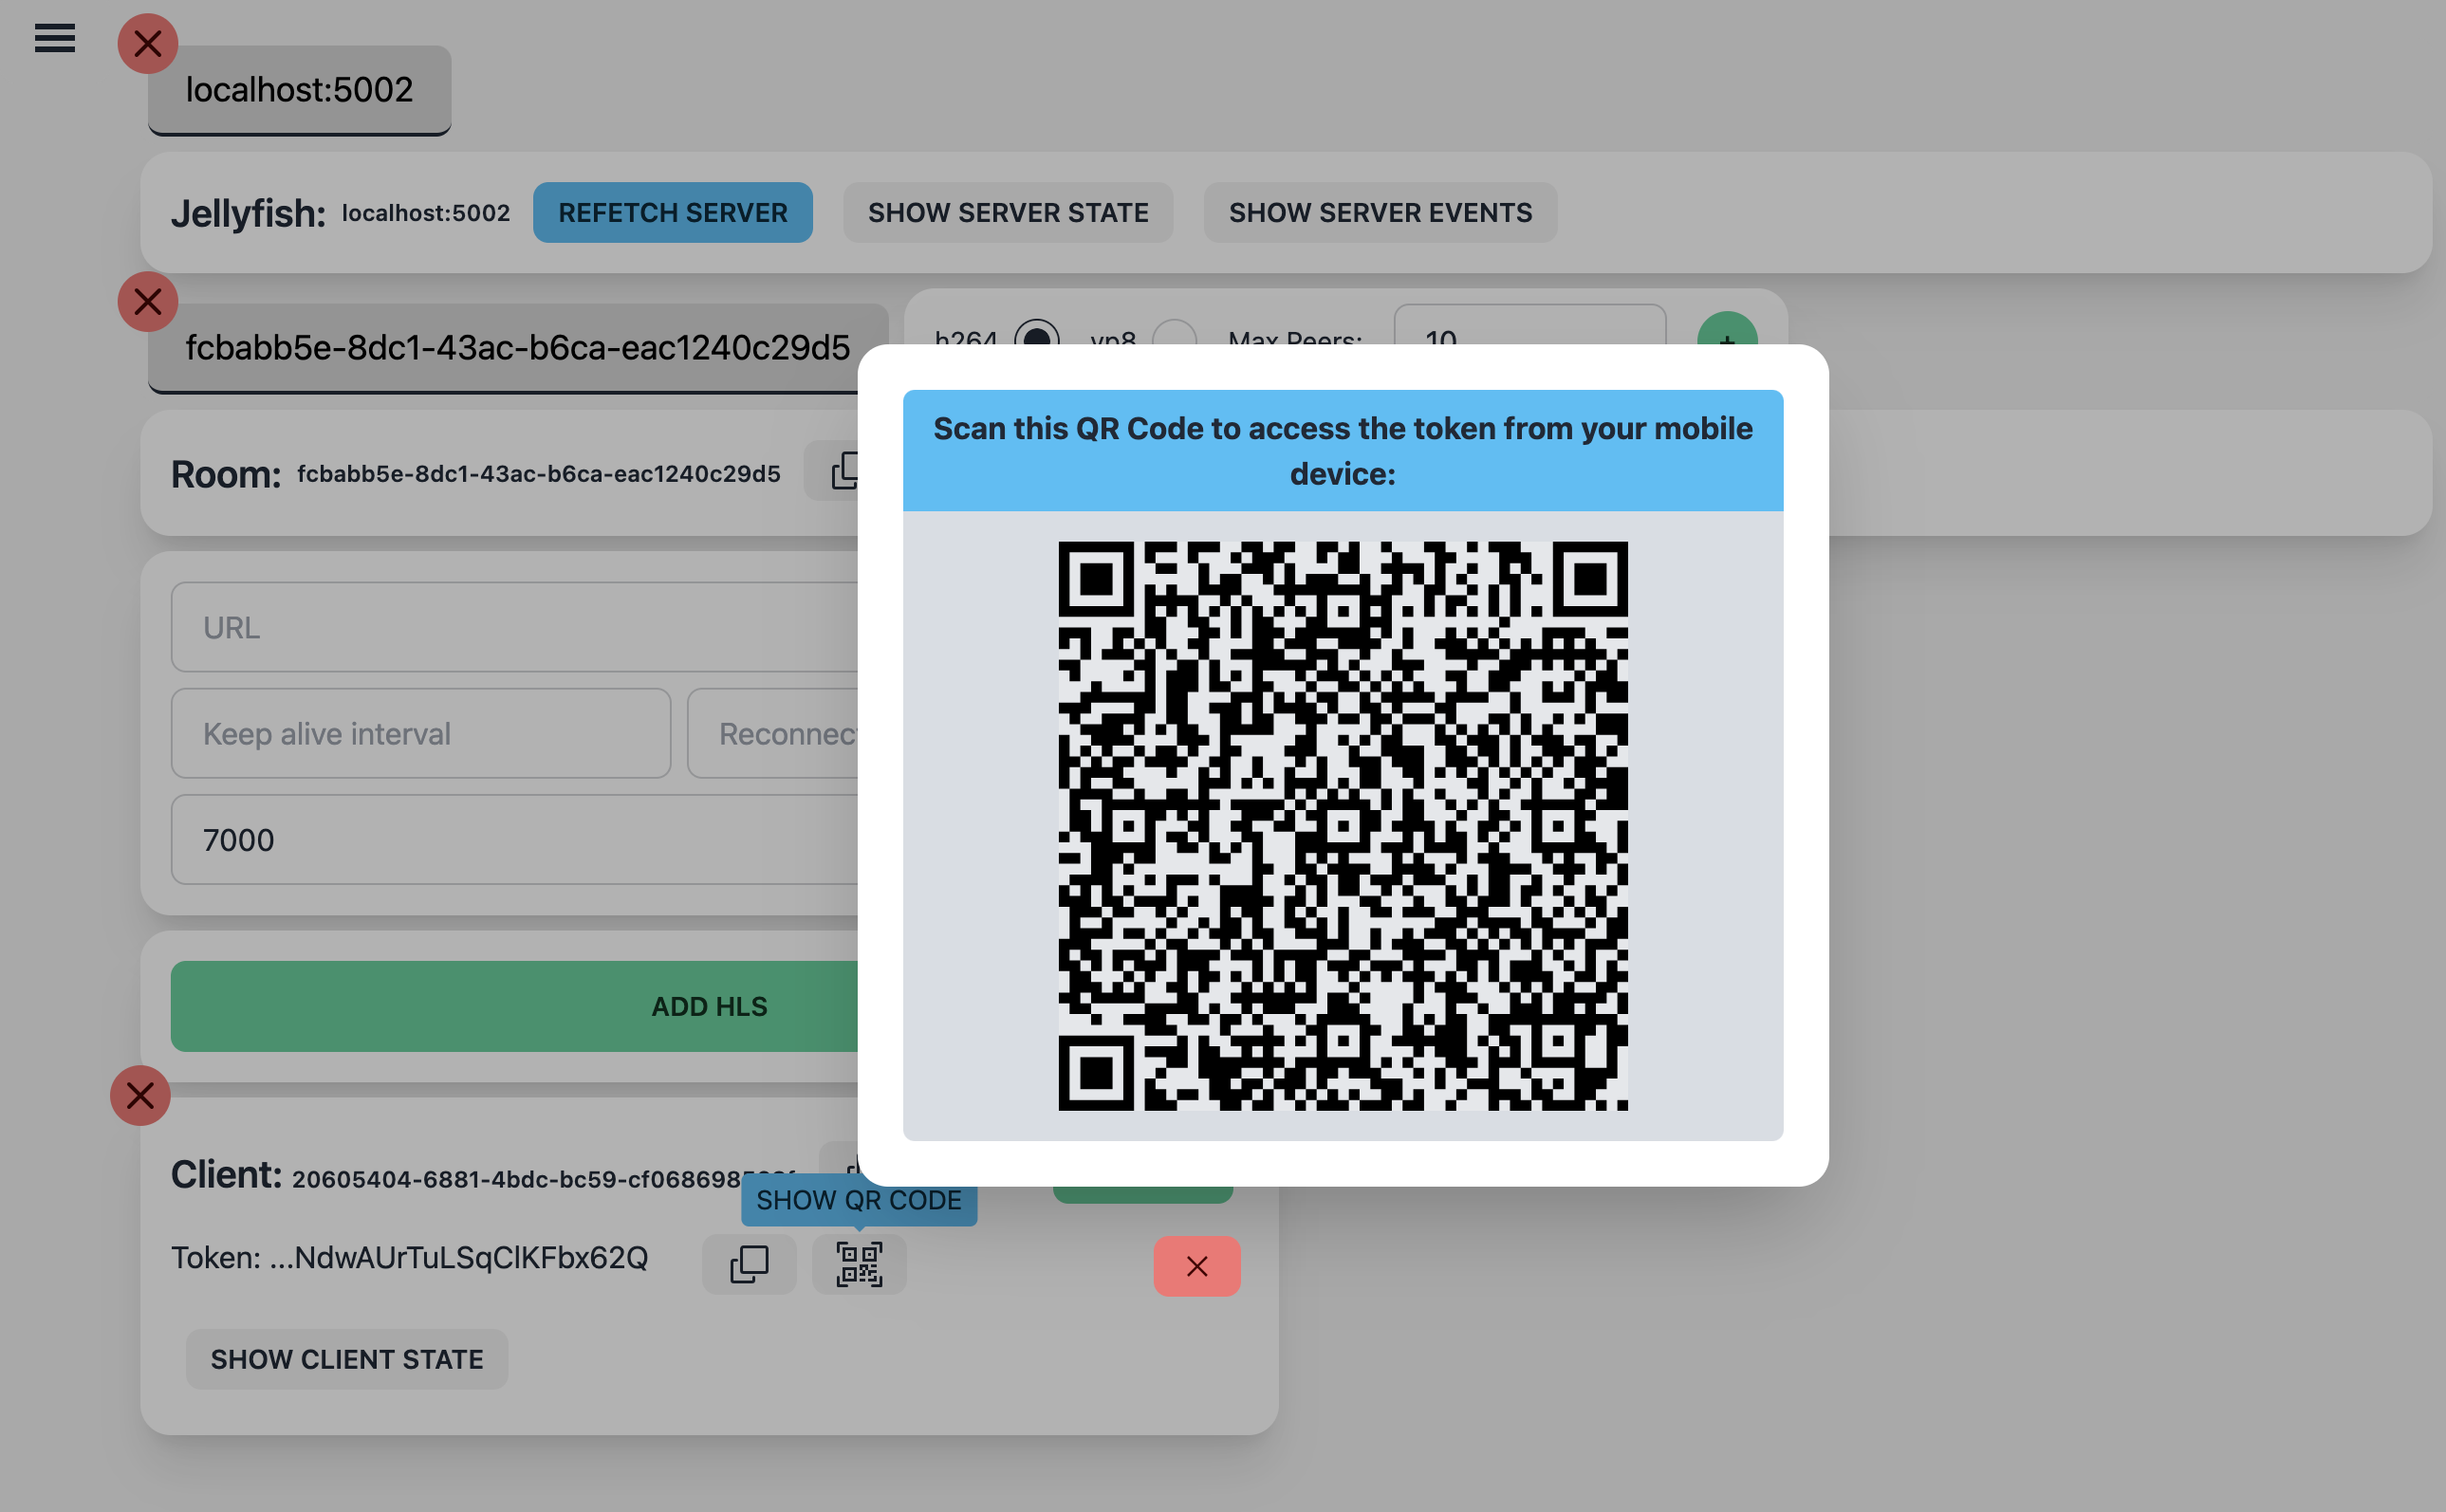
To connect the peer to the room, you can either press the Connect button in the peer's row, or scan the QR code with your mobile app, and connect there.
Sending tracks
When the peer connects to the room, you will see the track menu. It allows you to send tracks to the room.
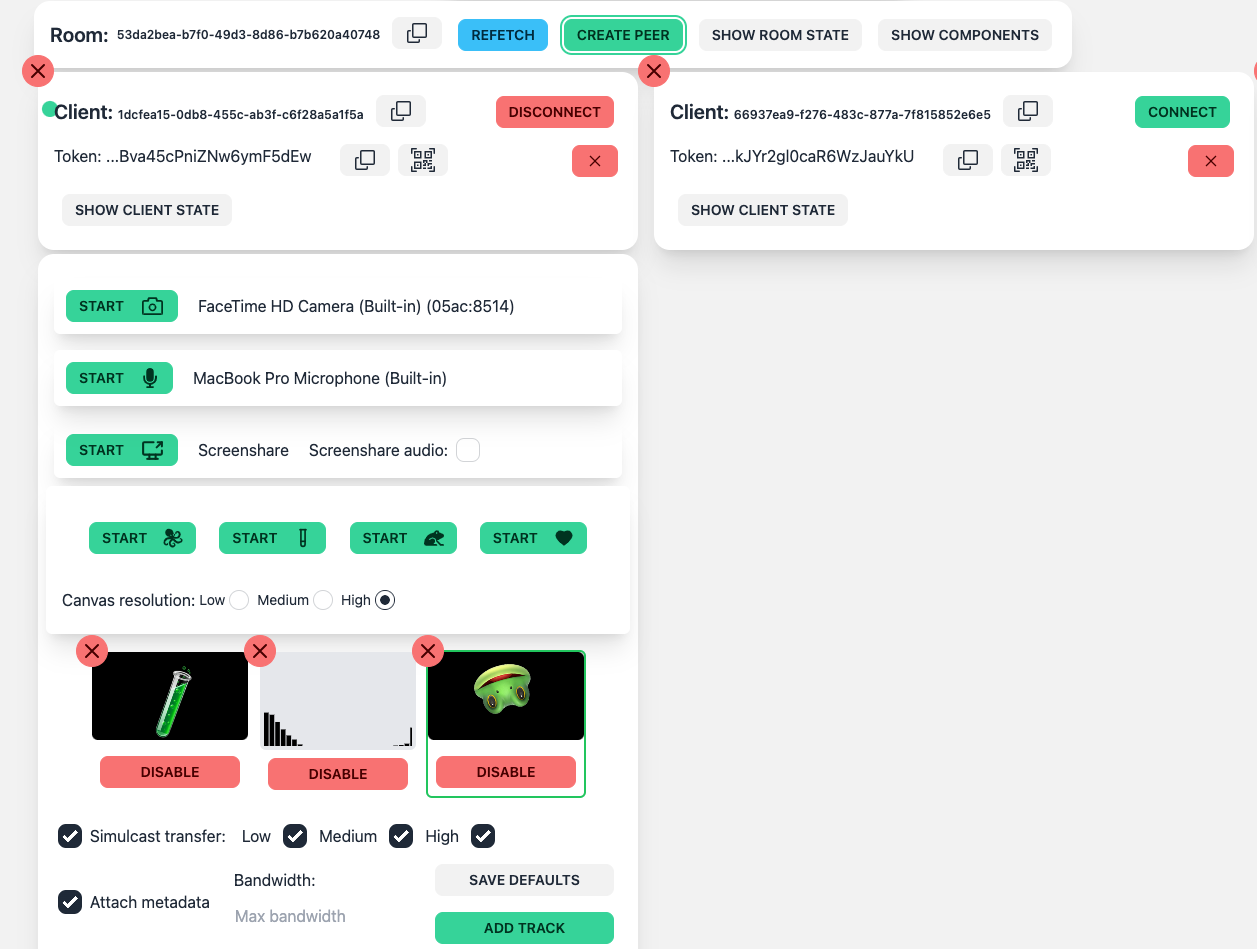
You can select the audio or video track you want to create. Created tracks will be visible in the list below. You can select any track from the list and send it to the room. Apart from your camera/microphone, you can easily share your screen with its audio or pick one from a list of mock tracks that we prepared.
You can also select the resolution of the video track or if you want, send the video as a simulcast stream.
There is also an option to add custom metadata (in JSON format) to the track. The peer will send metadata with the track to the room. Each recipient will be able to see it.
When you select the track, click the Add track button. If everything is correct, client will send the track to the room and other peers will be able to see and hear you.
Receiving tracks
When the peer connects to the room, it will automatically receive tracks from other peers.
Congrats! The basic utils of the dashboard are now covered. Next, we will dive into useful features that will help you with testing.
A ton of information that the dashboard provides
Server logs in console
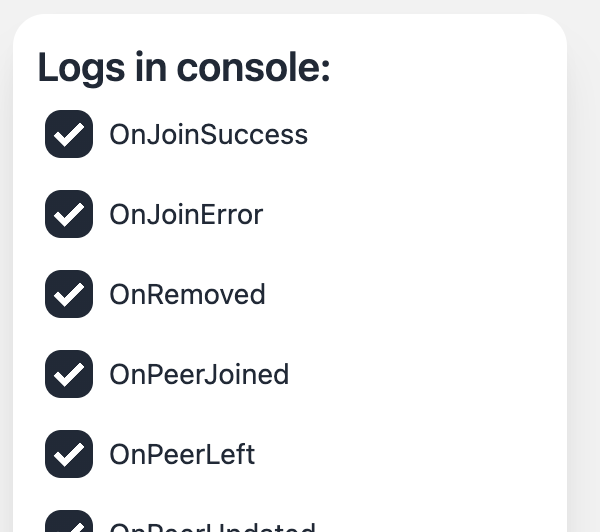
On the side menu, you can set up the dashboard to display React Client logs in the console. Logs are great for debugging purposes and provide insight into the various communications that occur between the dashboard and the Jellyfish Server. You can also register your event handlers in your Jellyfish-based projects, both in the React Client SDK and theTS Client SDK. These logs can show you when particular events occur and provide data that you can use in your own handlers
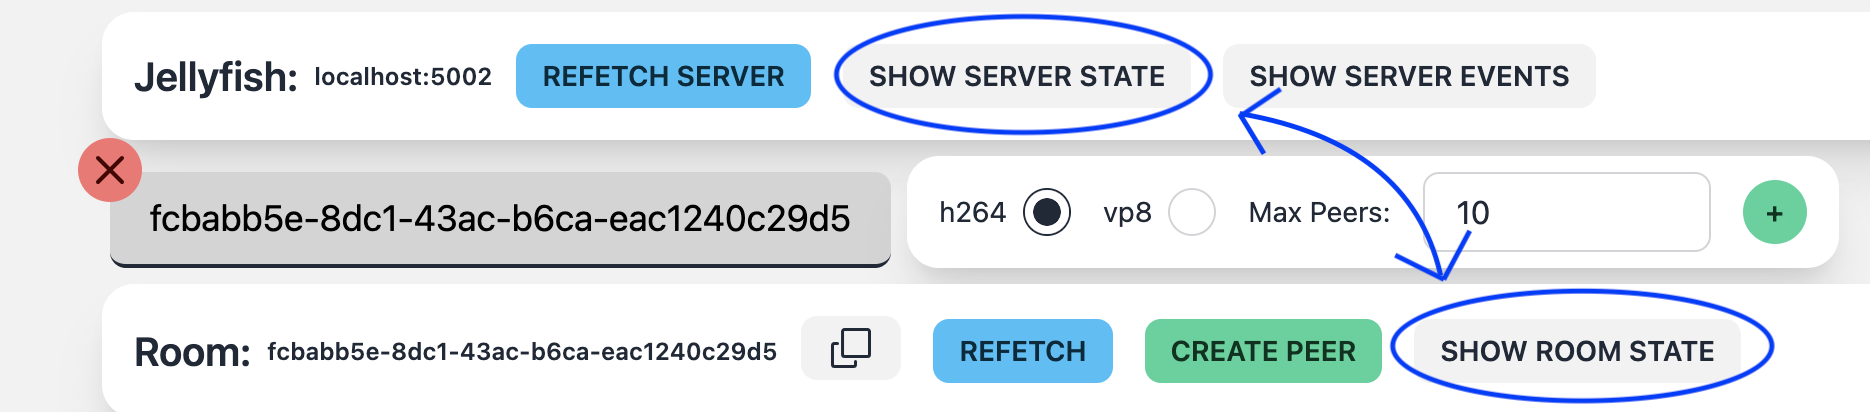
Server/Room/Client state
Each server, room, and client has its state. You can see the state of each of them in the dashboard by clicking appropriate buttons.
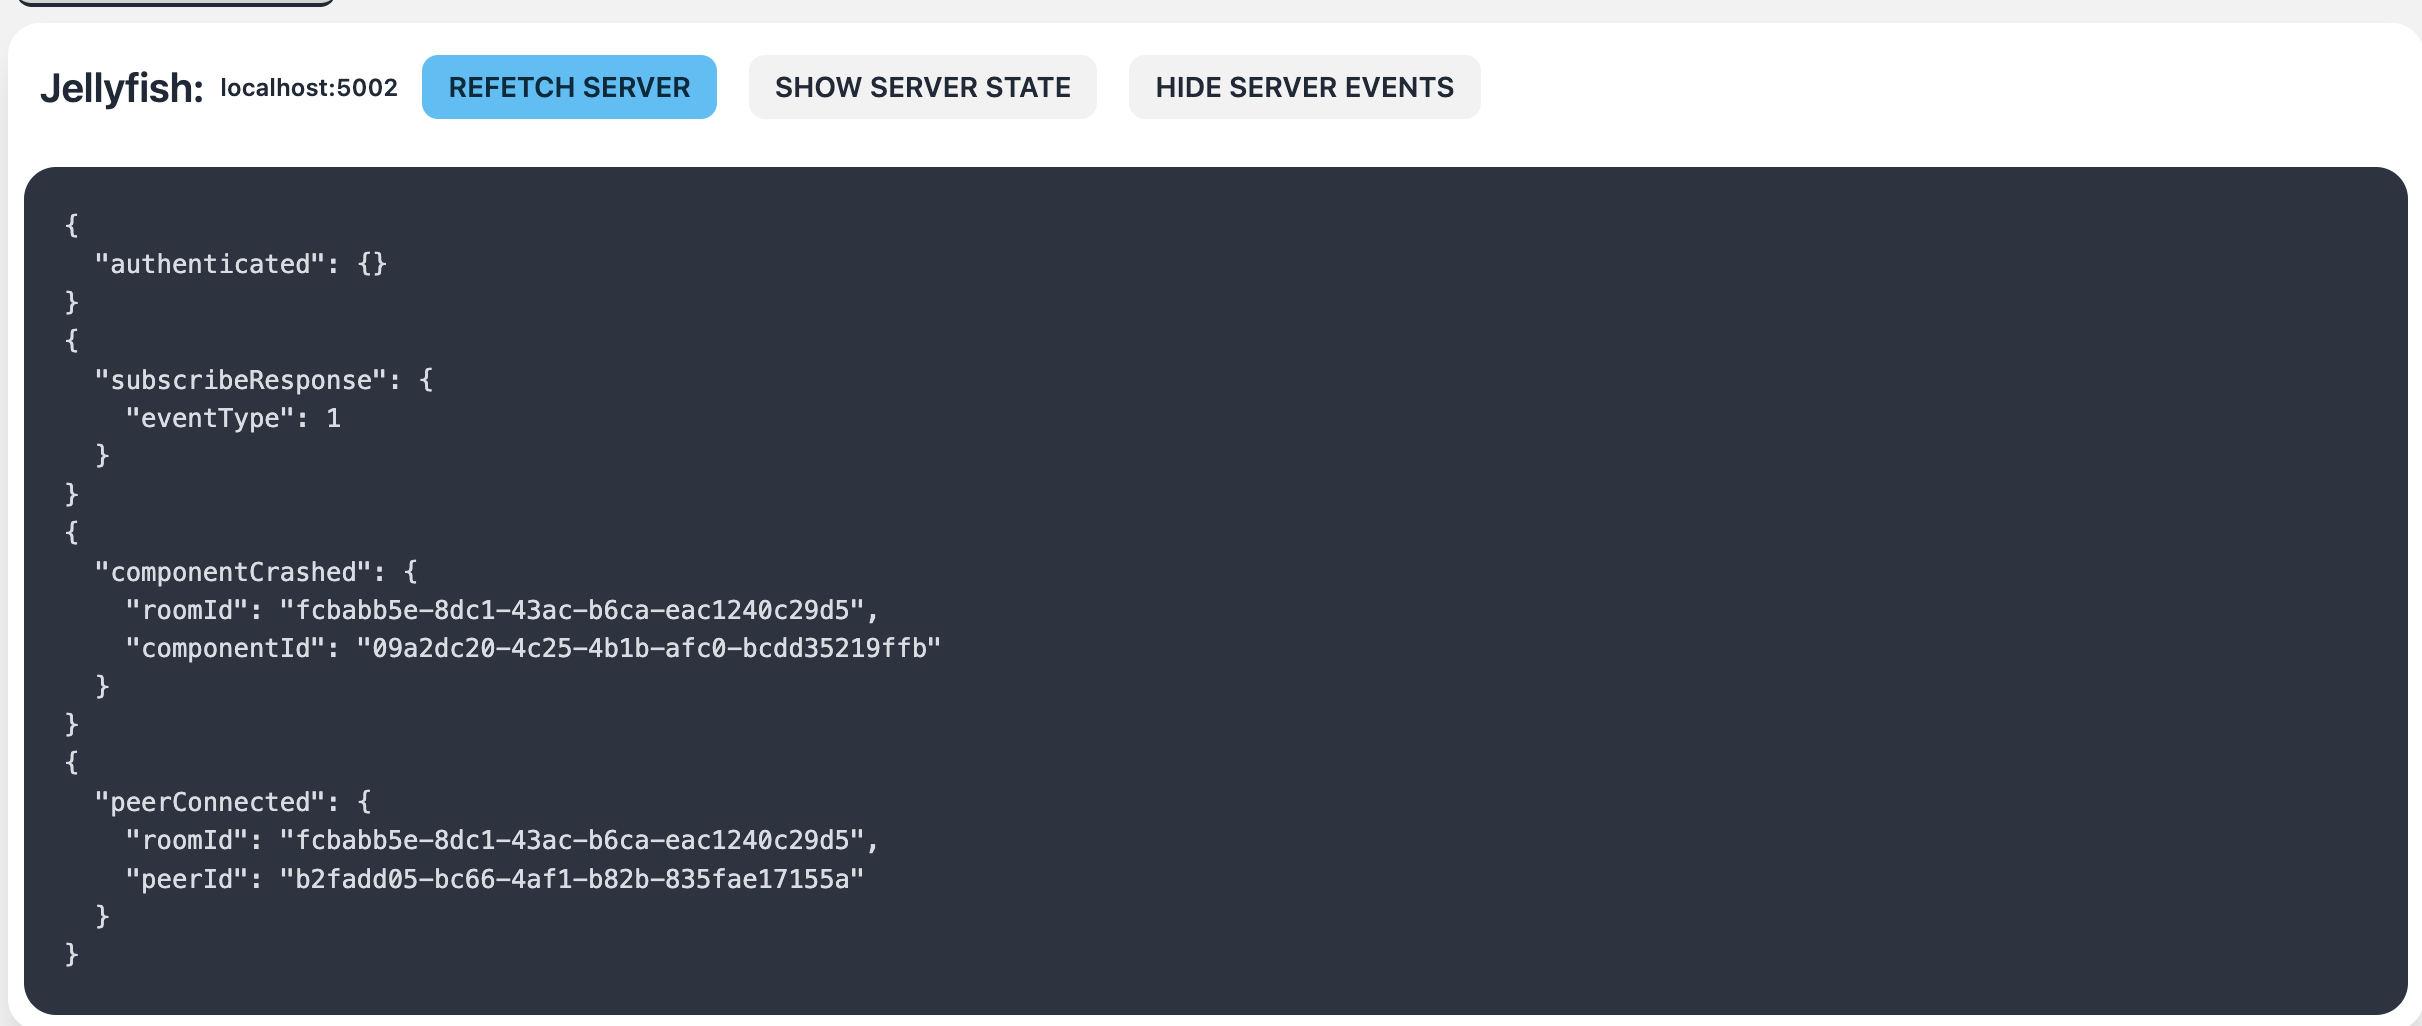
Server events
Apart from the state, you can also see the events that occur on the server.
You can see them after clicking the Show Server Events button.
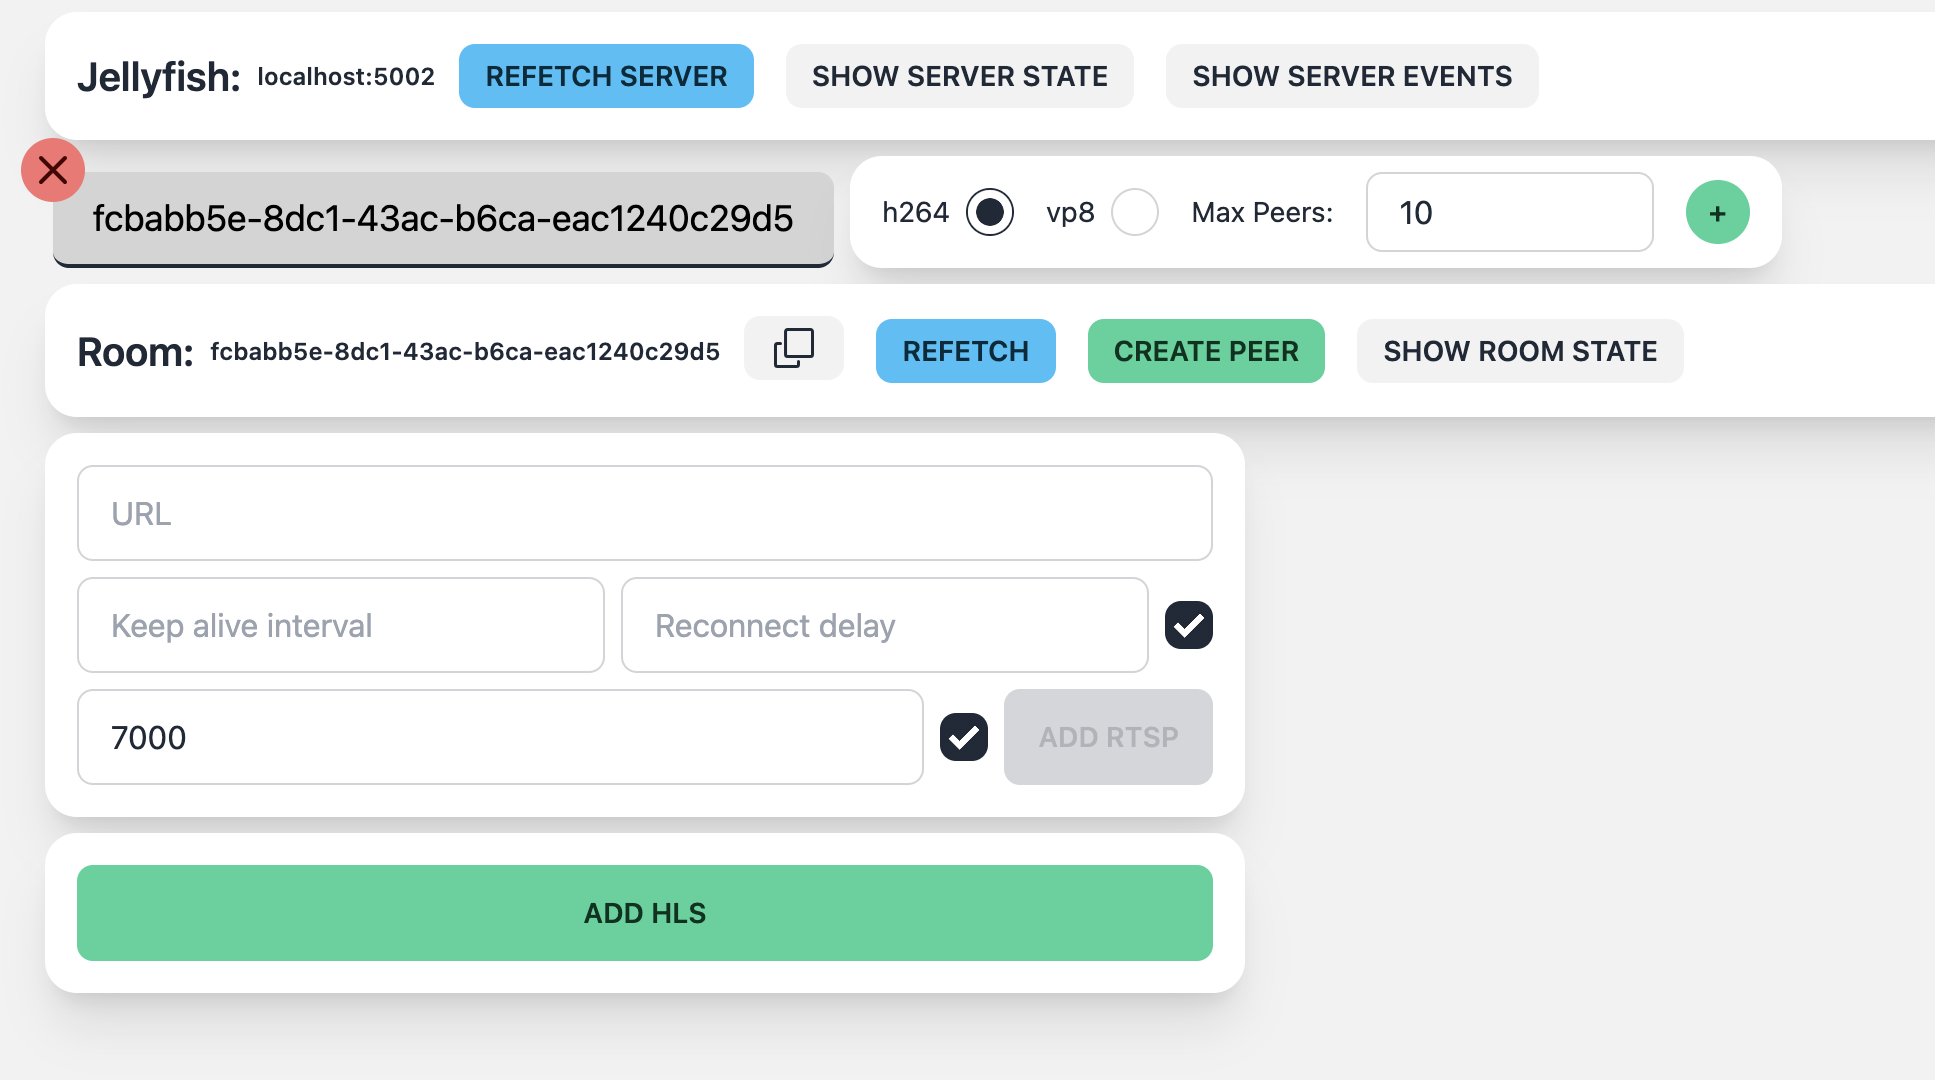
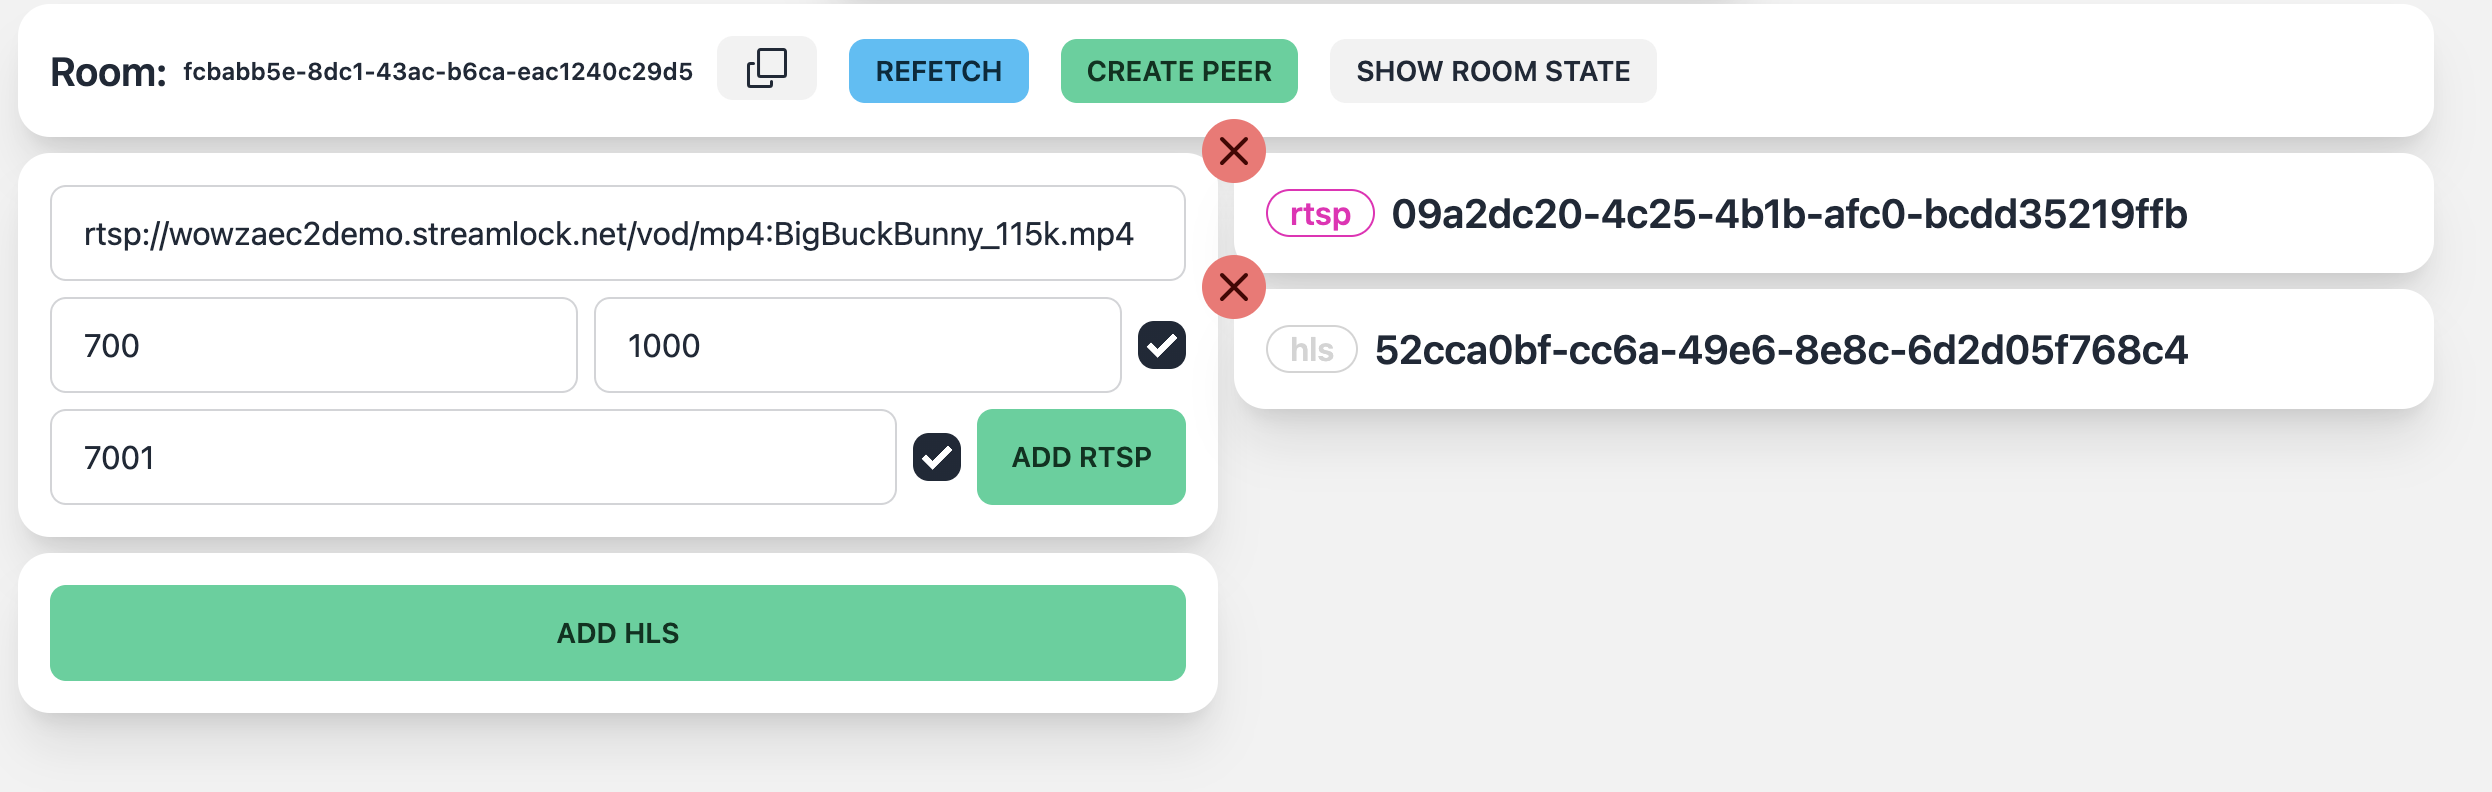
HLS and RTSP streaming
The dashboard allows adding HLS and RTSP streams in the room. You can set up the streams and see them in the room. It will look like this:
Loadbalancing in Dashboard
Jellyfish Server supports load balancing. This means you can run multiple instances of the server and use them simultaneously to distribute the load evenly among them. The dashboard reflects this feature. If you run multiple Jellyfish instances (which Docker Compose does by default), connect one server to the dashboard. When a server opens a room on a different instance, the Dashboard will automatically connect to it and display the room. When Jellyfish runs in a cluster, and the Dashboard requests a new room, it's created on the Jellyfish instance with the lowest load. Information about the specific Jellyfish instance that hosts the newly created room is returned in the HTTP response body.
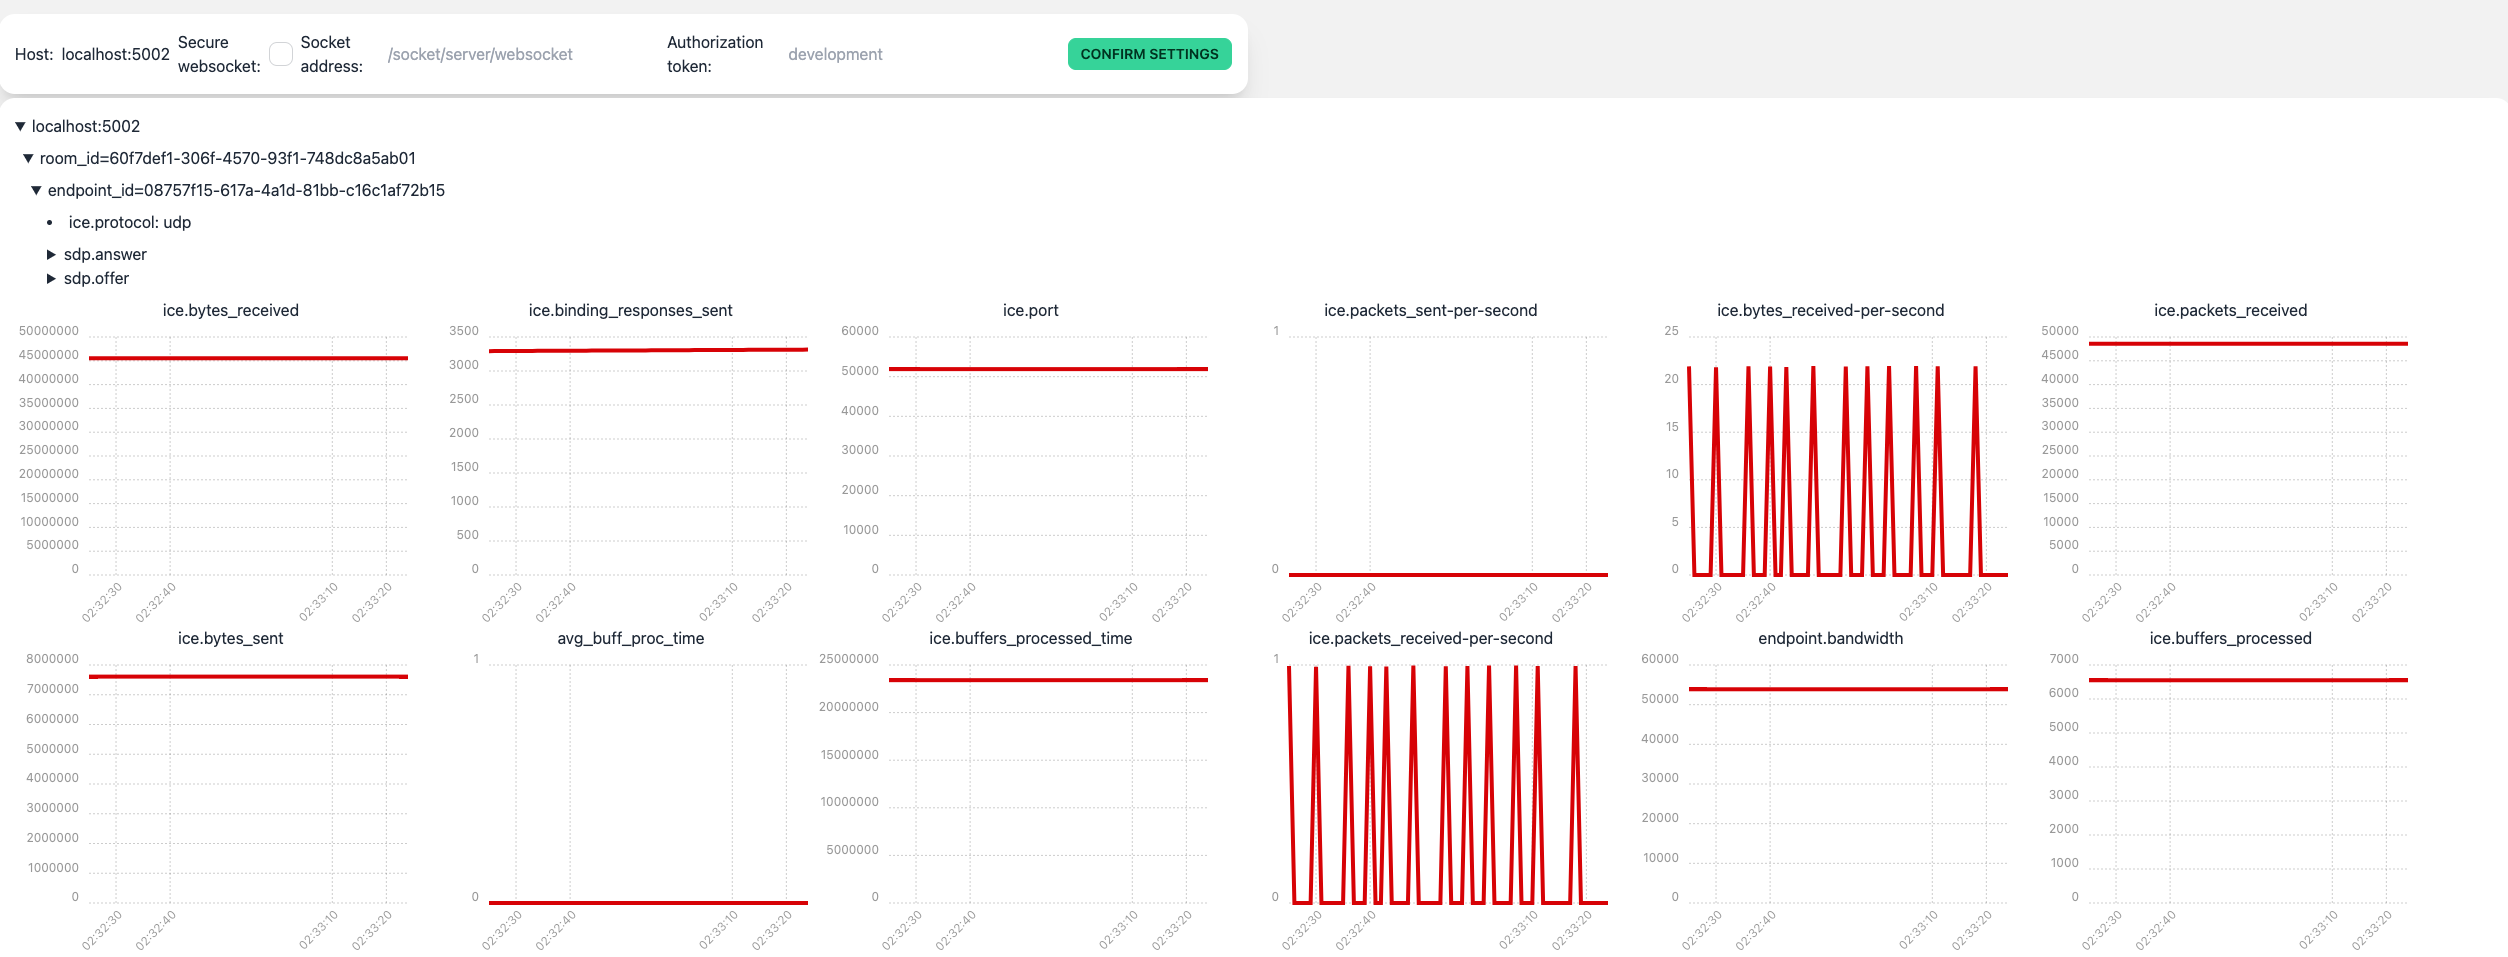
Data collected by Jellyfish
For each server, Jellyfish collects WebRTC statistics about the rooms, clients and streamed tracks. You can see them in the dashboard using the Internals button.
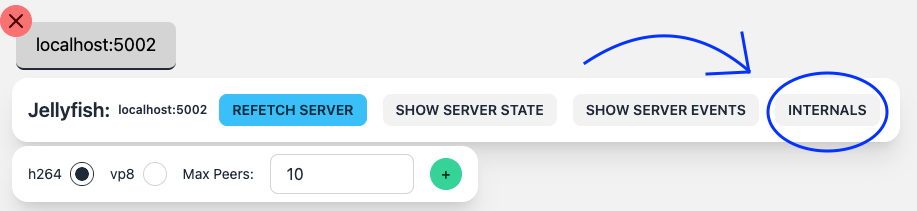
The button opens a new tab with the panel to connect to the WebSocket of the Jellyfish of choice. You can observe the data with the dynamically generated charts showing what flows through the Jellyfish.
Summary
Congrats on finishing the tutorial! You should now be able to use the dashboard to its full potential.
But this was just the beginning. Jellyfish Client API is a powerful tool that allows you to create your own web or mobile multimedia application. Check out the other tutorials to learn more about the Jellyfish Client API and how to use it in your projects.
You can also take a look at our fully featured Videoroom Demo example:
It's written in React Native, but it uses the same Jellyfish Client API as the dashboard, so you can learn a lot from it.